Operating margin is very simply defined: operating income divided by sales.
If a company’s operating margin is growing, then either its income is rising, its sales are slowing, or both. If its operating margin is shrinking, then either its income is falling, its sales are rising, or both. This isn’t much of a problem if the margin is shrinking or growing by a few percentage points. But a ten percent rise or fall in operating margin can indicate some serious problems. Because what you’d really like to see is a company whose sales are rising and whose income is rising too. In other words, you don’t really want to see operating margin grow or shrink very much. I’d much rather invest in a company with a stable operating margin than a rapidly growing one.
The stability of operating margin is just one of many metrics that are usually overlooked by investors, metrics that I have found extraordinarily useful in my investing.
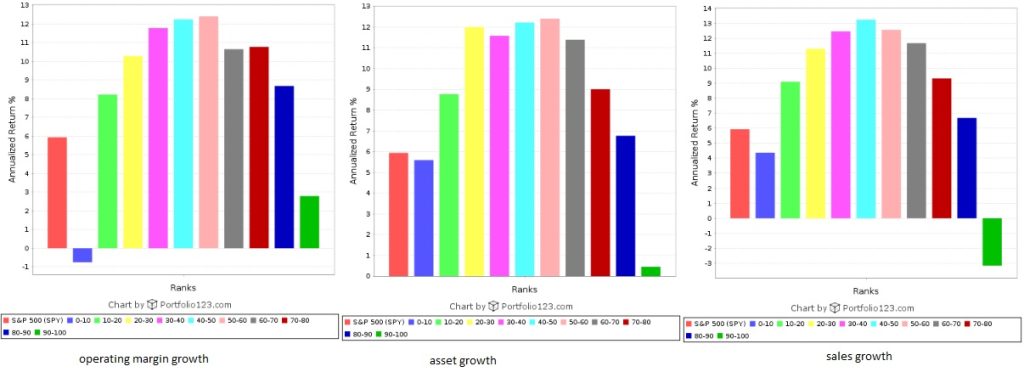
Take a look at the following three quantile charts, which I created on Portfolio123. The first measures the performance of the Russell 3000 since 1999 if you group stocks into deciles by operating margin growth, trailing twelve months minus previous twelve months, rebalancing monthly with no transaction costs. The second does the same except for asset growth: the ratio of the TTM total assets to that of the previous twelve months. The third does exactly the same but for sales rather than assets.

In each case, you see a parabolic graph; in each case the highest performance was in a middle decile, and the highest and lowest deciles performed worst. This is especially true for sales–notice how the decile with the highest sales growth not only performed worst of all deciles, but actually lost a considerable amount of money, and the fifth decile beat the market by an annualized seven percent. The reason is simple: extremely high growth is usually unsustainable.
You’ll get similar parabolic graphs if you measure year-on-year ROE growth, profit margin growth, book value growth, employee growth, income growth, and change in the cash conversion cycle. The only year-on-year growths I’ve found that look more like an upward slope are in dividends and free cash flow. Only in those cases is higher growth really better.
This is why it’s perilous to invest in companies that boast an operating margin twenty percent higher than last year’s, or sales fifty percent higher than last year’s, or that have doubled their assets through acquisitions. Companies with middling growth rates are the best investments.